
HYC GCSE Higher
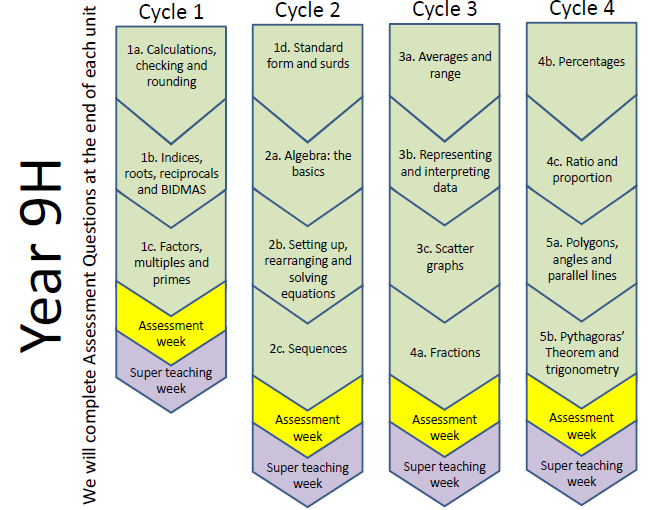

Y9H Unit 1a – Calculations, checking and roundingMathswatch
Add, subtract, multiply and divide decimals and whole numbers.17, 18, 19, 20
Multiply or divide by any number between 0 and 1.66,67
Put digits in the correct place in a decimal calculation and use one calculation to find the answer to another.92
Round numbers to the nearest 10, 100, 1000.31
Round to the nearest integer, to a given number of decimal places and to a given number of significant figures.31, 32 ,90
Estimate answers to one- or two-step calculations, including use of rounding numbers and formal estimation to 1 significant figure.90
Y9H Unit 1b – Indices, roots and BIDMAS
Use index notation for integer powers of 10, including negative powers.82
Recognise powers of 2, 3, 4, 5.82, 80
Find the value of calculations using indices including positive, fractional and negative indices. Also know how to use a calculator for powers and roots.131, 154
Understand that the inverse operation of raising a positive number to a power n is raising the result of this operation to the power 1/n131
Use index laws to simplify and calculate the value of numerical expressions involving multiplication and division of integer powers, fractional and negative powers, and powers of a power.131, 154
Use brackets and the hierarchy of operations up to and including with powers and roots inside the brackets, or raising brackets to powers or taking roots of brackets.75, 81
Y9H Unit 1c – Factors, multiples and primes
Identify factors, multiples and prime numbers.28
Find the prime factor decomposition of positive integers – write as a product using index notation.78
Find common factors and common multiples of two numbers.79, 80
Find the LCM and HCF of two numbers, by listing, Venn diagrams and using prime factors – include finding LCM and HCF given the prime factorisation of two numbers.79, 80, 127a
Solve problems using HCF and LCM, and prime numbers.79, 80
Y9H Unit 1d – Standard form and surds
Convert large and small numbers into and out of standard form. Also know how to do this on a calculator.83
Add and subtract numbers in standard form.83
Multiply and divide numbers in standard form.83
Understand surd notation.207a
Simplify surd expressions involving squares.207b
Perform simple calculations with surds.207b
Y9H Unit 2a – Algebra: the basics
Use algebraic notation and symbols correctly and write expressions.7
Know the difference between a term, expression, equation, formula and an identity.137
Manipulate an expression by collecting like terms and by cancelling.33
Substitute positive and negative numbers into expressions and into formulae from other subjects.95
Multiply a single term over a bracket and factorise into a single bracket.93
Expand the product of two linear expressions.134b
Factorise quadratic expressions of the form ax2 + bx + c and using the difference of two squares.157, 158
Y9H Unit 2b – Setting up, rearranging and solving equations
Set up simple equations from word problems and derive simple formulae.137
Understand the ≠ symbol (not equal), and the identity ≡ sign.7
Solve linear equations, with integer coefficients, in which the unknown appears on either side or on both sides of the equation.135
Solve linear equations which contain brackets, including those that have negative signs occurring anywhere in the equation, and those with a negative solution.135
Solve linear equations in one unknown, with integer or fractional coefficients.135
Change the subject of a simple formula and then including cases where the subject is on both sides of the original formula, or involving fractions and small powers of the subject.136
Use iteration to find approximate solutions to equations.180
Y9H Unit 2c - Sequences
Identify Sequences.104, 141
Generate a sequence from a term-to-term rule.37
Understand geometric progressions.163
Generate a linear sequence from an nth term rule.102
Find the nth term rule of a linear sequence.103
Generate a quadratic sequence from an nth term rule.102
Find the nth term rule of a quadratic sequence.213
Y9H Unit 3a – Averages and range
Design and interpret two-way tables for discrete and grouped data.61
Calculate mean and range, find median and mode from a small data set.62
Recognise the advantages and disadvantages between measures of average.
Construct and interpret stem and leaf diagrams (including back-to-back diagrams); use them to find the mode, median and range and compare distributions.128b, 62
Calculate the mean, mode, median and range from a frequency table (discrete data).130a
Construct and interpret grouped frequency tables for continuous data; find which interval contains the median, estimate the mean (and understand why it is only an estimate).130b
Y9H Unit 3b – Representing and interpreting data
Produce and interpret composite bar charts and dual bar charts.15
Produce and interpret pie charts.128a
Produce and interpret frequency polygons for grouped data.65b
Produce frequency diagrams for grouped discrete data.65a
Produce histograms with equal class intervals.205
Produce line graphs, including time series.153
Y9H Unit 3c – Scatter graphs
Draw and interpret scatter graphs.129
Draw lines of best fit by eye, understanding what these represent.129
Identify outliers and ignore them on scatter graphs.129
Use a line of best fit, or otherwise, to predict values of a variable given values of the other variable. Interpolate and extrapolate but know the dangers of doing so.129
Distinguish between positive, negative and zero correlation using lines of best fit, and interpret correlation in terms of the problem.129
Understand that correlation does not imply causality, and that zero correlation does not necessarily imply ‘no relationship’ but merely ‘no linear correlation’.129
Y9H Unit 4a – Fractions
Express a given number as a fraction of another.
Find equivalent fractions and compare the size of fractions.25
Write a fraction in its simplest form.26
Find a fraction of a quantity or measurement, including within a context.72
Convert between mixed numbers and improper fractions.(KS3) N35
Multiply and divide fractions, including mixed numbers and whole numbers.73, 74
Add and subtract fractions, including mixed numbers.71
Convert a fraction to a recurring decimal.177
Convert a recurring decimal to a fraction.177
Find the reciprocal of an integer, decimal or fraction.76
Y9H Unit 4b - Percentages
Convert between fractions, decimals and percentages.85
Express one number as a percentage of another.88, 89
Calculate a percentage of an amount without and with a calculator (using multipliers).86, 87
Increase or decrease an amount by a percentage.108, 111, 164
Calculate percentage change.109
Solve reverse percentage problems.110
Y9H Unit 4c – Ratio and proportion
Write ratios in their simplest form or in the form 1:n or n:1 and to describe a situation.38
Divide a given quantity into two or more parts in a given part:part or part:whole ratio.106
Use a ratio to find one quantity when the other is known.106
Write a ratio as a fraction or a linear function.107
Identify direct proportion from a table of values, by comparing ratios of values.42
Use a ratio to compare a scale model to real-life object.38
Use a ratio to convert between measures and currencies.105
Solve ratio problems involving recipes.39
Y9H Unit 5a – Polygons, angles and parallel lines
Classify triangles and quadrilaterals by their properties.9
Calculate missing angles in a triangle.121, 122
Explain the angle sum of a quadrilateral and use it to find missing angles.123
Recall and apply the angle properties of parallel lines.120
Calculate and use the interior angle sum of polygons.123
Use the exterior angle sum of polygons to solve problems.123
Solve angle problems in regular polygons.123
Y9H Unit 5b – Pythagoras and Trigonometry
Use Pythagoras’ Theorem to solve 2D problems.150b
Find the length of a line segment.150c
Use sin, cos and tan to find lengths.168
Use sin, cos and tan to find angles.168
Use sin, cos and tan to solve problems.168
Know exact values for sin, cos and tan ratios for key angles.173
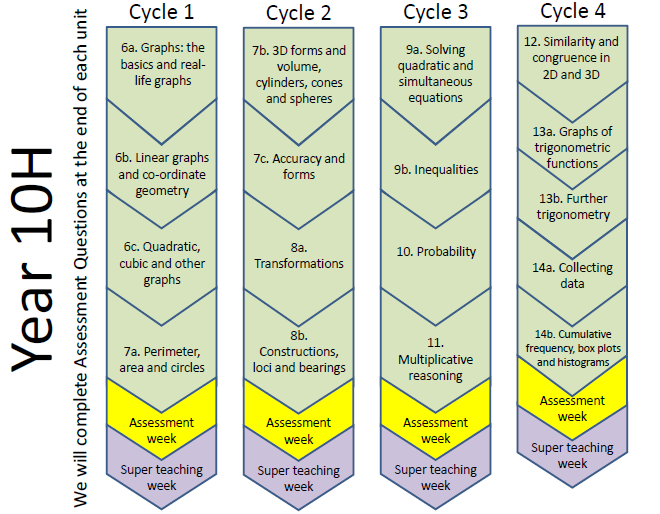
Y10H Unit 6a - GraphsMathswatch
Identify and plot co-ordinates in all four quadrants and find the co-ordinates of the midpoint of a line8, 133
Draw and interpret straight-line graphs for real-life situations, including ready reckoner graphs, conversion graphs, fuel bills, fixed charge and cost per item.
Draw distance–time and velocity–time graphs143, 216
Use graphs to calculate various measures (of individual sections), including: unit price (gradient), average speed, distance, time, acceleration; including using enclosed areas by counting squares or using areas of trapezia, rectangles and triangles.143, 53, 56
Find the equation of the line through two given points.159b
Y10H U6b – Linear and co-ordinate geometry
Plot and draw graphs of y=a, x=a, y=x and y=–x.96, 97
Identify and interpret the gradient and y-intercept of a linear graph given by equations of the form y = mx + c. Plot and draw graphs of straight lines of the form y = mx + c with and without a table of values.96
96
Find the equation of a straight line from a graph in the form y=mx+c.159a
Find the equation of the line through one point with a given gradient.159b
Plot graphs of straight lines in the form ax + by = c. Find the equation of a straight line from a graph in the form ax + by = c.96, 159a
Interpret and analyse information presented in a range of linear graphs; use gradients to interpret how one variable changes in relation to another, find approximate solutions to a linear equation from a graph, identify direct proportion from a graph.107
Interpret and analyse a straight-line graph and generate equations of lines parallel and perpendicular to the given line.97, 208
Y10H Unit 6c - Quadratic and cubic graphs
Recognise a linear, quadratic, cubic, reciprocal and circle graph from its shape.98, 161
Generate points and plot graphs of simple quadratic functions, then more general quadratic functions.98
Find approximate solutions of a quadratic equation from the graph of the corresponding quadratic function.
Draw graphs of simple cubic functions using tables of values. Interpret graphs of simple cubic functions, including finding solutions to cubic equations.161
Draw graphs of the reciprocal function.161
Plot exponential graphs194
Draw circles, centre the origin, equation x2 + y2=r2.197
Y10H Unit 7a – Perimeter, area and circles
Recall and use the formulae for the area of a triangle, rectangle, trapezium and parallelogram using a variety of metric measures.53, 54, ,55, 56
Calculate the area of compound shapes made from triangles, rectangles, trapezia and parallelograms using a variety of metric measures.53, 54, 55, 56
Find the perimeter of a rectangle, trapezium, parallelogram and compound shapes using a variety of metric measures.52
Recall the definition of a circle and name and draw parts of a circle.116
Recall and use formulae for area and circumference of circles. Be able to give answers in terms of π.118, 117
Calculate perimeters and areas of composite shapes made from circles and parts of circles.118
Calculate arc lengths, angles and areas of sectors of circles.149
Find radius or diameter, given area or circumference of circles in a variety of metric measures.117, 118
Y10H Unit 7b - 3D shapes
Sketch 3D solids and identify planes of symmetry.11
Calculate the surface area of a prism.114a/b
Calculate the volume of a prism.119
Convert between metric units of volume and capacity.112
Calculate the surface area and volume of a pyramid.170
Use the formula for the volume and surface areas of cones and spheres171,169
Calculate the volume and surface area of more complex 3D shapes.169, 170, 171, 172
Sketch 3D solids and identify planes of symmetry.11
Calculate the surface area of a prism114a/b
Calculate the volume of a prism.119
Convert between metric units of volume and capacity.112
Y10H Unit 7c - Accuracy & bounds
Calculate the upper and lowers bounds of numbers given to varying degrees of accuracy.132
Calculate the upper and lower bounds of an expression involving the four operations.206
Find the upper and lower bounds in real-life situations using measurements given to appropriate degrees of accuracy.206
Find the upper and lower bounds of calculations involving perimeters, areas and volumes of 2D and 3D shapes.206
Upper and lower bounds of calculations involving measurements206
Use inequality notation to show error intervals155
Y10H Unit 8a - Transformations
Perform and describe rotations of 2D shapes.49
Perform and describe reflections of 2D shapes, including finding the equation of the line of reflection.48
Perform and describe translations of 2D shapes using vectors.50
Perform and describe enlargements of 2D shapes for positive, negative and fractional scale factors.148, 181a
Perform and describe combinations of transformations.182
Understand the impact of enlargement on area and volume.200
Y10H Unit 8b – Construction, loci and bearings
Understand and draw front and side elevations and plans of shapes made from simple solids.51
Given the front and side elevations and the plan of a solid, draw a sketch of the 3D solid.51
Understand, draw and measure bearings.124
Calculate bearings and solve bearings problems.
Use the standard ruler and compass constructions; bisect an angle, construct a perpendicular to a given line from/at a given point, construct angles of 90° and 45°, perpendicular bisector of a line segment.145, 146
Construct a region bounded by a circle and an intersecting line, a given distance from a point and a given distance from a line, equal distances from two points or two line segments.165
Y10H Unit 9a – Solving quadratic and simultaneous equations
Factorise a quadratic ax2+bx+c192
Set up and solve quadratic equations by factorisation157
Solve quadratic equations by completing the square209a/b/c
Solve quadratics using the quadratic formula191
Solve two linear simultaneous equations140/162
Solve simultaneous equations with one linear and one quadratic (including x2+y2=r2)211
Set up a pair of equations to solve
Y10H Unit 9b – Inequalities
Show inequalities on number lines.138
Write down whole number values that satisfy an inequality.
Solve simple linear inequalities in one variable, and represent the solution set on a number line.139, 138
Solve two linear inequalities in x, find the solution sets and compare them to see which value of x satisfies both solve linear inequalities in two variables algebraically.139
Y10H Unit 10 - Probability
Write probabilities using fractions, percentages or decimals.59
Understand and use experimental and theoretical measures of probability, including relative frequency.125
Estimate the number of times an event will occur.
Find the probability of successive events, such as several throws of a single dice.59
List all outcomes for single events, and combined events, systematically. Use this to find probabilities.58, 126
Know that the sum of the probabilities of all outcomes is 1. Use 1 – p as the probability of an event not occurring.60
Work out probabilities from Venn diagrams to represent real-life situations and also ‘abstract’ sets of numbers/values. Use union and intersection notation.127a/b
Use a tree diagram to calculate independent and conditional probability.151, 175
Y10H Unit 11 – Proportion and compound measures
Express a multiplicative relationship between two quantities as a ratio or a fraction.38
Solve proportion problems using the unitary method.42
Work out which product offers best value and consider rates of pay.41
Represent repeated proportional change using a multiplier raised to a power, use this to solve problems involving compound interest and depreciation.164
Understand and use compound measures; convert between metric speed, density and pressure measures. Use kinematics formulae.142
Calculate an unknown quantity from quantities that vary in direct or inverse proportion.199
Recognise when values are in direct proportion by reference to the graph form, and use a graph to find the value of k in y=kx.199
Y10H Unit 12 – Similarity and congruence in 2D and 3D
Understand and use SSS, SAS, ASA and RHS conditions to prove the congruence of triangles using formal arguments.166
Solve angle problems by first proving congruence.166
Prove that two shapes are similar by showing that all corresponding angles are equal in size and/or lengths of sides are in the same ratio/one is an enlargement of the other, giving the scale factor.
Find missing lengths, areas and volumes in similar 3D solids.144, 200
Solve problems involving frustums of cones where you have to find missing lengths first using similar triangles.172
Y10H Unit 13a – Graphs of trigonometric functions
Recognise, sketch and interpret graphs of the trigonometric functions (in degrees)
y=sin x, y=cos x and y=tan x for angles of any size195a/b
Know the exact values of sin θ and cos θ for θ=0°, 30°, 45° , 60° and 90° and exact value of tan θ for θ=0°, 30°, 45° and 60° and find them from graphs.173
Apply to the graph of y=f(x) the transformations y=–f(x), y=f(–x) for sine, cosine and tan functions f(x).196b
Apply to the graph of y=f(x) the transformations y=f(x)+a, y=f(x+a)
for sine, cosine and tan functions f(x).196b
Y10H Unit 13b – Further trigonometry
Know and apply Area=1/2absinC to calculate the area, sides or angles of any triangle.203
Know the sine and cosine rules, and use to solve 2D problems (including involving bearings).201, 202
Use the sine and cosine rules to solve 3D problems201, 202
Understand, recall and use trigonometric relationships and Pythagoras’ Theorem in right-angled triangles, and use these to solve problems in 3D configurations. Calculate the length of a diagonal of a cuboid.217, 218
Find the angle between a line and a plane.218
Y10H Unit 14a – Collecting data
Plan what data to collect and what analysis is needed. Understand primary and secondary data sources, considering fairness.
Understand how different sample sizes may affect the reliability of conclusions drawn.152
Understand what is meant by a sample and a population.152
Write questions to eliminate bias, and understand how the timing and location of a survey can ensure a sample is representative.152
Y10H Unit 14b – Cumulative frequency, box plots and histograms
Know the appropriate uses of cumulative frequency diagrams; construct and interpret cumulative frequency tables.186
Interpret cumulative frequency diagrams; estimate frequency greater/less than a given value, find the median and quartile values and interquartile range.186
Compare the mean and range of two distributions, or median and interquartile range, as appropriate. Interpret box plots to find median, quartiles, range and interquartile range and draw conclusions.62, 186
Produce box plots from raw data and when given quartiles, median and identify any outliers.187
Know the appropriate uses of histograms; construct and interpret histograms from class intervals with unequal width.205
Complete a grouped frequency table from a histogram,205
understand and define frequency density. Use a histogram to estimate the mean.
Estimate the median from a histogram with unequal class widths or any other information from a histogram, such as the number of people in a given interval.205
Y11H Unit 15 – Harder brackets and harder graphsMathswatch
Sketch a graph of a quadratic function, by factorising or by using the formula, identifying roots, y-intercept and turning point by completing the square.99, 160
Be able to identify from a graph if a quadratic equation has any real roots. Find approximate solutions to quadratic equations using a graph.160
Expand the product of more than two linear expressions.134b
Sketch a graph of a quadratic function and a linear function, identifying intersection points.99
Sketch graphs of simple cubic functions, given as three linear expressions.
Solve simultaneous equations graphically; find approximate solutions to simultaneous equations formed from one linear function and one quadratic function using a graphical approach, find graphically the intersection points of a given straight line with a circle.140
Solve quadratic inequalities in one variable, by factorising and sketching the graph to find critical values.
Y11H Unit 16a – Circle theorems
Recall the definition of a circle and identify (name) and draw parts of a circle, including sector, tangent, chord, segment.116
Recall and apply the circle theorems to solve problems. Give reasons at each stage when solving problems.183
Prove the fact that; the angle subtended by an arc at the centre of a circle is twice the angle subtended at any point on the circumference; the angle in a semicircle is a right angle;the perpendicular from the centre of a circle to a chord bisects the chord;angles in the same segment are equal;alternate segment theorem;opposite angles of a cyclic quadrilateral sum to 180°.184
Y11H Unit 16b – Circle geometry
Select and apply construction techniques and understanding of loci to draw graphs based on circles and perpendiculars of lines.165
Find the equation of a tangent to a circle at a given point, by: finding the gradient of the radius that meets the circle at that point (circles all centre the origin); finding the gradient of the tangent perpendicular to it; using the given point.149
Recognise and construct the graph of a circle using x2+y2=r2 for radius r centred at the origin of coordinates.197
Y11H Unit 17 – Rearranging, algebraic fractions, surds and proof
Rationalise the denominator of surds.207c
Simplify algebraic fractions.210a
Multiply and divide algebraic fractions.210a
Solve quadratic equations arising from algebraic fraction equations.210b
Change the subject of a formula, including cases where the subject occurs on both sides of the formula, or where a power of the subject appears, or where all variables are in the denominators.190
Solve ‘Show that’ and proof questions using consecutive integers (n, n+1), squares a2, b2, even numbers 2n, odd numbers 2n+1.193
Use function notation; Find the inverse of a linear function; For two functions f(x) and g(x), find gf(x).214a
Y11H Unit 18 – Vectors and geometric proof
Understand and use vector notation, including column notation. Understand that 2a is parallel to a and twice its length, and that a is parallel to –a in the opposite direction.219
Represent vectors, combinations of vectors and scalar multiples in the plane pictorially.219
Calculate the sum of two vectors, the difference of two vectors and a scalar multiple of a vector using column vectors (including algebraic terms).219
Find the length of a vector using Pythagoras’ Theorem.150b
Calculate the resultant of two vectors.219
Solve geometric problems in 2D where vectors are divided in a given ratio.219
Produce geometrical proofs to prove points are collinear and vectors/lines are parallel.
Y11H Unit 19a – Reciprocal and exponential graphs and area under graphs
Recognise, sketch and interpret graphs of the reciprocal function. State the value of x for which the equation is not defined.161
Recognise, sketch and interpret graphs of exponential functions.194
Use calculators to explore exponential growth and decay.
Interpret and analyse transformations of graphs of functions and write the functions algebraically, e.g. write the equation of f(x)+a, or f(x–a).196a
Apply to the graph of y = f(x) the transformations y=–f(x), y=f(–x), y=f(x)+a, y=f(x+a) for linear, quadratic, cubic functions.196a
Estimate area under a quadratic or other graph by dividing it into trapezia.56
Interpret the gradient of linear or non-linear graphs, and estimate the gradient of a quadratic or non-linear graph at a given point by sketching the tangent and finding its gradient.
Interpret the gradient of non-linear graphs in a range of real life contexts.
Y11H Unit 19b – Direct and inverse proportion
Recognise and interpret graphs showing direct and inverse proportion.199
Identify direct proportion from a table of values, by comparing ratios of values, for x squared and x cubed relationships.199
Write statements of proportionality for quantities proportional to the square, cube or other power of another quantity. Set up and use equations to solve word and other problems involving direct proportion.199
Solve problems involving inverse proportion using graphs by plotting and reading values from graphs.199
Set up and use equations to solve word and other problems involving direct proportion or inverse proportion.199